48 services available
Architecture design from scratch: cloud selection, services, CI/CD, monitoring. Full documentation and diagrams inclu...
20000 ₴
Corporate identity management: Active Directory, OpenLDAP, Bitwarden/Vaultwarden. SSO integration for all services.
8000 ₴
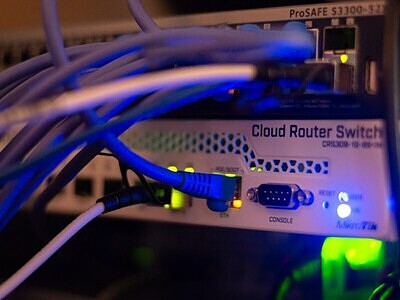
MikroTik router configuration: firewall, NAT, VPN, VLAN, QoS, monitoring. RouterOS. 18+ years of network administrati...
5000 ₴
pfSense installation and configuration: firewall rules, VPN, IDS/IPS, traffic shaping. Enterprise-grade firewall solu...
6000 ₴
Free SSL setup: Certbot, automatic renewal, Nginx configuration with TLS 1.2+. HTTP → HTTPS redirect. Secure by default.
2000 ₴
ISO 27001 implementation support: security policies, access control, audit. Experience maintaining ISO 27001 complian...
10000 ₴
Цей сайт використовує файли cookie для забезпечення найкращого досвіду. Продовжуючи користуватися сайтом, ви погоджуєтесь на використання cookie.